Day Trading GPS VWAP Bull/Bear KPL Navigator and 50 similar items

Free Shipping
Day Trading GPS VWAP Bull/Bear KPL Navigator Indicator - Tradingview (Lifetime)
$179.00
View full item details »

Shipping options
Estimated to arrive by Tue, Sep 30th.
Details
FREE via USPS Media Mail (2 to 9 business days) to United States
Offer policy
OBO - Seller accepts offers on this item.
Details
Return policy
None: All purchases final
Purchase protection
Payment options
PayPal accepted
PayPal Credit accepted
Venmo accepted
PayPal, MasterCard, Visa, Discover, and American Express accepted
Maestro accepted
Amazon Pay accepted
Nuvei accepted
View full item details »
Shipping options
Estimated to arrive by Tue, Sep 30th.
Details
FREE via USPS Media Mail (2 to 9 business days) to United States
Offer policy
OBO - Seller accepts offers on this item.
Details
Return policy
None: All purchases final
Purchase protection
Payment options
PayPal accepted
PayPal Credit accepted
Venmo accepted
PayPal, MasterCard, Visa, Discover, and American Express accepted
Maestro accepted
Amazon Pay accepted
Nuvei accepted
Item traits
| Category: | |
|---|---|
| Quantity Available: |
10 in stock |
| Condition: |
New |
| Brand: |
Day Trading GPS |
| Indicator Type: |
Trading |
Listing details
| Seller policies: | |
|---|---|
| Posted for sale: |
September 13 |
| Item number: |
1768073057 |
Item description
Day Trading GPS VWAP Bull/Bear KPL Navigator Indicator for Tradingview - Lifetime Access
Advanced trading analysis tool that combines auto-anchored market specific VWAP with daily key price levels hit probability statistics.
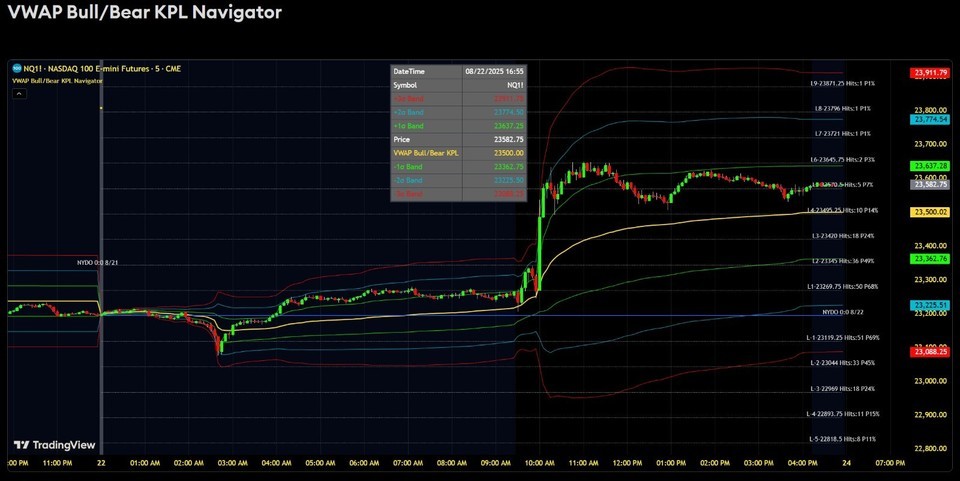
The Day Trading GPS VWAP Bull/Bear KPL Navigator is an advanced market analysis tool that combines volume-weighted price analysis with standard deviation bands and daily projection levels (with statistical probabilities of those levels being hit during current session) to identify market conditions and potential trading opportunities. It features automatic session detection and its VWAP anchoring automatically adjusts to different market types (Stocks, ETFS, ADRS, Forex Currency Pairs, Forex CFDS, Futures, Cryptocurrencies, Indexes) for optimal performance.
Key Components
VWAP Bull/Bear KPL Line (Yellow)
- Acts as the primary reference point for market direction
- Adapts automatically to different market conditions and sessions
- Provides a dynamic measure of average price weighted by volume
Standard Deviation Bands
1. **First Standard Deviation (Green)**
- Represents normal market volatility range
- Most common area for price movement
- Useful for identifying potential support/resistance
2. **Second Standard Deviation (Blue)**
- Indicates increased volatility
- Potential reversal zones
- Less common price territory
3. **Third Standard Deviation (Red)**
- Represents extreme market conditions
- Rare price territory
- Strong potential for mean reversion
Daily Projection Levels
- Projects potential price levels based on daily range
- Automatically calculates levels using Average Daily Range (ADR)
- Displays up to 10 levels above and 10 levels below the daily open to accommodate low, moderate and extreme volatility conditions
- Each level can display:
- Level number (L1, L2, etc.)
- Level Price
- Hit count tracking
- Probability percentage
Dashboard
- Displays real-time values for:
- Current date/time and symbol
- Price and VWAP Bull/Bear KPL level
- All standard deviation band levels
- Customizable position and appearance
Trading Applications
Market Analysis
1. **Trend Direction**:
- Price above VWAP Bull/Bear KPL line suggests bullish bias
- Price below VWAP Bull/Bear KPL line suggests bearish bias
- VWAP Bull/Bear KPL line slope indicates trend strength
2. **Volatility Assessment**:
- Distance between bands shows market volatility
- Expanding bands indicate increasing volatility
- Contracting bands suggest decreasing volatility
3. **Mean Reversion Opportunities**:
- Price moves to outer bands often return to VWAP Bull/Bear KPL
- Stronger reversal potential at higher deviation bands
- Band touches can signal potential entry points
4. **Daily Level Analysis**:
- Levels help understand expected daily price ranges
- Higher probability levels represent common price zones
- Lower probability levels suggest potential reversal zones
- Hit counts and probabilities are more accurate on higher timeframes
Session Management
1. **Automatic Reset**:
- Automatically resets anchored VWAP for different market types each trading day
- Maintains accuracy across different sessions and market types
2. **Market Type VWAP Anchoring Optimization**:
- Automatically adjusts VWAP anchoring for optimal performance on different market types (Stocks, ETFS, ADRS, Forex Currency Pairs, Forex CFDS, Futures, Cryptocurrencies, Indexes)
Best Practices
1. **Band Usage**:
- Use closer bands (1?) for conservative entries
- Middle bands (2?) for normal trading conditions
- Outer bands (3?) for extreme conditions
- Consider band width for volatility assessment
2. **Signal Confirmation**:
- Look for price acceptance/rejection at bands
- Consider multiple timeframe analysis
- Watch for divergence between price and KPL
3. **Risk Management**:
- Wider stops in higher volatility conditions
- Tighter stops when bands are closer together
- Consider reducing position size at extreme bands
4. **Daily Level Usage**:
- Low probability levels suggest increased reversal potential: When price reaches levels with low historical hit rates (typically below 30%), this indicates an extreme move that often precedes a reversal. These zones represent price areas where the market has rarely sustained movement beyond.
- Consider taking profits as price approaches low probability levels: As your position moves into these extreme zones, it's prudent to begin scaling out or fully exiting your trades. The statistical rarity of these levels maintaining suggests increased risk of reversal.
- Look for reversal opportunities near low probability zones: These areas often present high-probability counter-trend trading opportunities. The market's tendency to mean-revert from extreme levels can provide favorable risk/reward setups for reversal trades.
- Use higher timeframes for more reliable probability data: Daily and higher timeframe probability calculations offer more statistically significant data due to reduced noise. This provides more reliable signals compared to shorter timeframe probability calculations.
- Consider exiting positions near extreme probability levels: When price reaches levels with very low probability scores (15% or less), this suggests an overextended move. These extreme zones often precede sharp reversals and increased volatility.
- Look for counter-trend entries near low probability zones: These areas can provide excellent opportunities for mean reversion trades. The statistical improbability of sustained movement beyond these levels often results in profitable counter-trend positions when combined with proper risk management.
Settings Guidelines
Line Settings
- VWAP Bull/Bear KPL Line: Adjust color and width for visibility
- Standard Deviation Bands: Customize appearance for each level
- Consider reducing opacity for clearer price action viewing
Dashboard Configuration
- Position: Choose based on chart layout
- Text Size: Adjust for readability
- Colors: Customize for personal preference
- Background: Modify transparency as needed
All sales are final
Product details:
Brand: Day Trading GPS (DT-GPS)
Platform: Tradingview
Language: English
Purchase includes: 1 (One) Tradingview indicator:
DT-GPS VWAP Bull/Bear KPL Navigator
License: Lifetime
Delivery: Indicator is for the tradingview charting platform only. All of our indicators are digital items are not shipped but electronically transmitted to buyer's acct with tradingview.
After purchasing the indicator Buyer is required to message Seller with buyer's correct tradingview user name so we can transmit the indicator purchased to Buyer's account with tradingview.
Free Shipping: We Don't send CD or Any Other Hard copy to your physical address. All of our indicators are digital items are not shipped but electronically transmitted to buyer's acct with tradingview.
After purchasing the indicator Buyer is required to message Seller with buyer's correct tradingview user name so we can transmit the indicator purchased to Buyer's account with tradingview.
****Please note:
We do not give refunds based on the performance of the product. There are many factors that can affect the performance and results of the product such as brokers, internet connection and the experience of the user. You are receiving a working product that has been tested and all sales are final.
Disclaimer and Risk Warning:
All Trading involves risk. Leveraged trading has large potential rewards, but also large potential risk. Be aware and accept this risk before trading. Never trade with money you cannot afford to lose. Past performance of any trading methodology is no guarantee of future results.
We are not financial advisors and anything stated in our listings, pictures, videos and/or other materials are not investing or financial advice. You should always understand that with any type or form of trading or investing there is always risk. You should always do your own research before making any trade or investment. All indicator(s) are for use on the tradingview platform only and require appropriate live data subscription(s) on TradingView. Trading and/or investing in financial markets carries substantial risk of loss and is not suitable for every investor. The performance of the indicators are not guaranteed and past performance does not indicate future results. The signals and information provided by the indicator(s) should not be used as the sole basis for any trading or investment decision. Users of the indicator(s) should: - Understand that no indicator can predict market movements with certainty - Never risk more capital than they can afford to lose - Develop and follow a comprehensive trading plan and risk management strategy - Consider seeking professional financial advice before trading - Be aware that market conditions can change rapidly and without warning - Understand that technical analysis tools and indicators are supplementary and not predictive - Know that successful trading and/or investing requires education, practice, and proper risk management. The creators and distributors of this indicator: - Do not guarantee any specific trading results or profits - Are not responsible for any trading decisions made using this indicator - Make no claims about the indicator's future performance - Cannot be held liable for any losses incurred while using the indicator. This indicator is provided for reference purposes only. The user bears full responsibility for any trading or investment outcomes.
The seller holds no responsibility for any losses, damages, or issues arising from the use of this indicator
By using the indicator, you acknowledge that you understand these risks and accept full responsibility for your trading and/or investment decisions.
|
Why are we showing these items?
Search Results
Category "Indicators"
|


-
Refine your browsing experience
We can show you more items that are exactly like the original item, or we can show you items that are similar in spirit. By default we show you a mix.


This item has been added to your cart
 Day Trading GPS VWAP Bull/Bear KPL Navigator Indicator - Tradingview (Lifetime) added to cart.
10 available in stock
Day Trading GPS VWAP Bull/Bear KPL Navigator Indicator - Tradingview (Lifetime) added to cart.
10 available in stock
View Cart or continue shopping.
 Please wait while we finish adding this item to your cart.
Get an item reminder
We'll email you a link to your item now and follow up with a single reminder (if you'd like one). That's it! No spam, no hassle.
Already have an account?
Log in and add this item to your wish list.